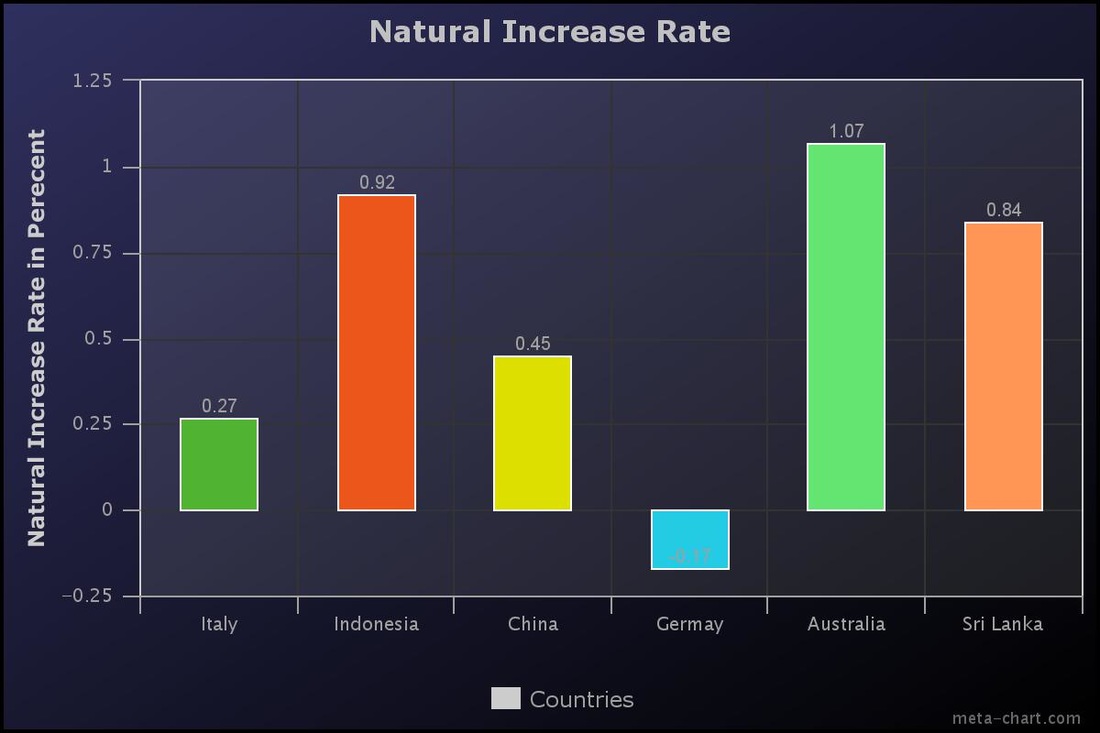
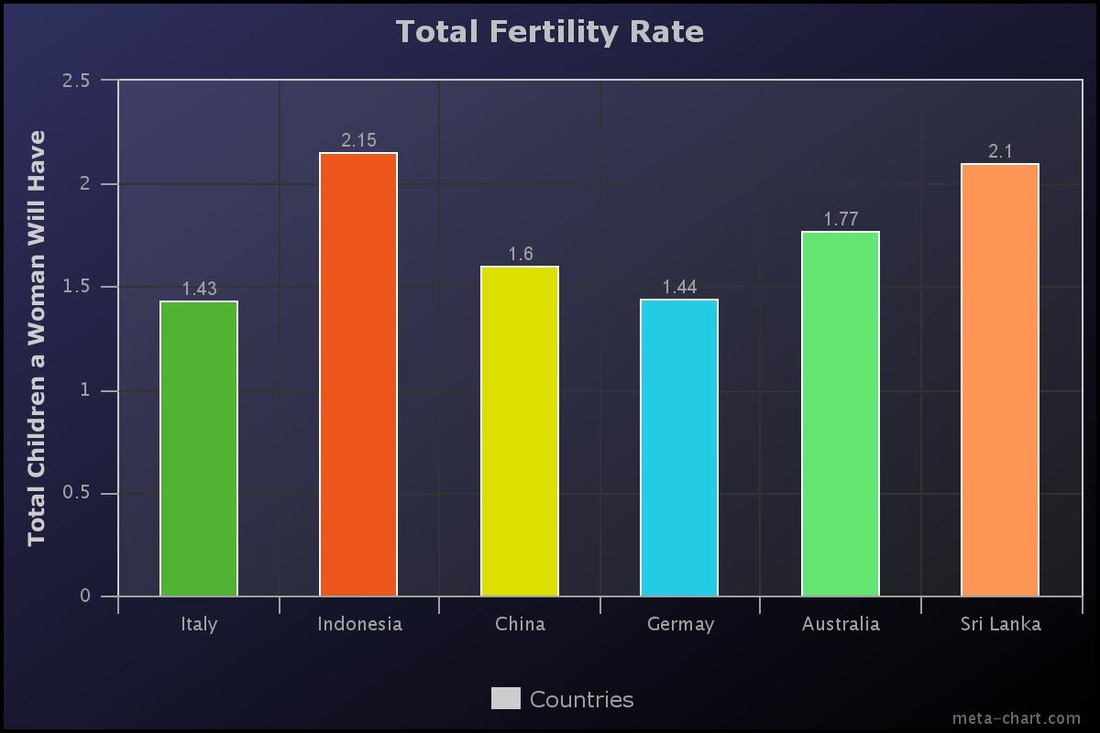
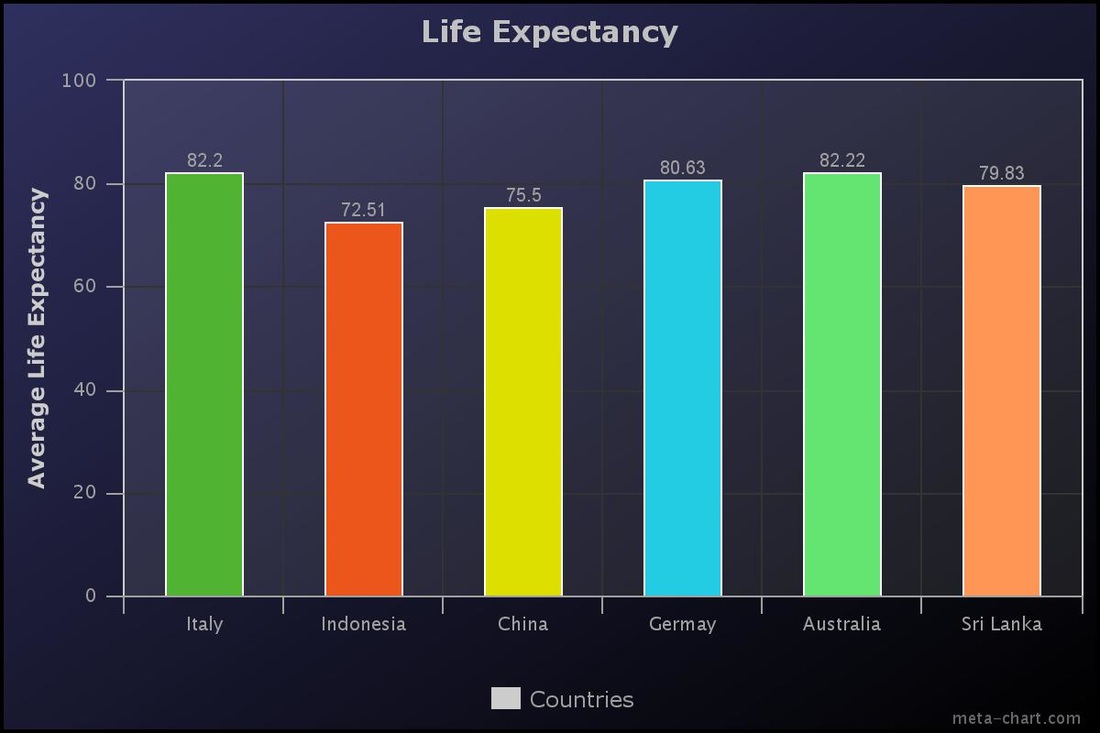
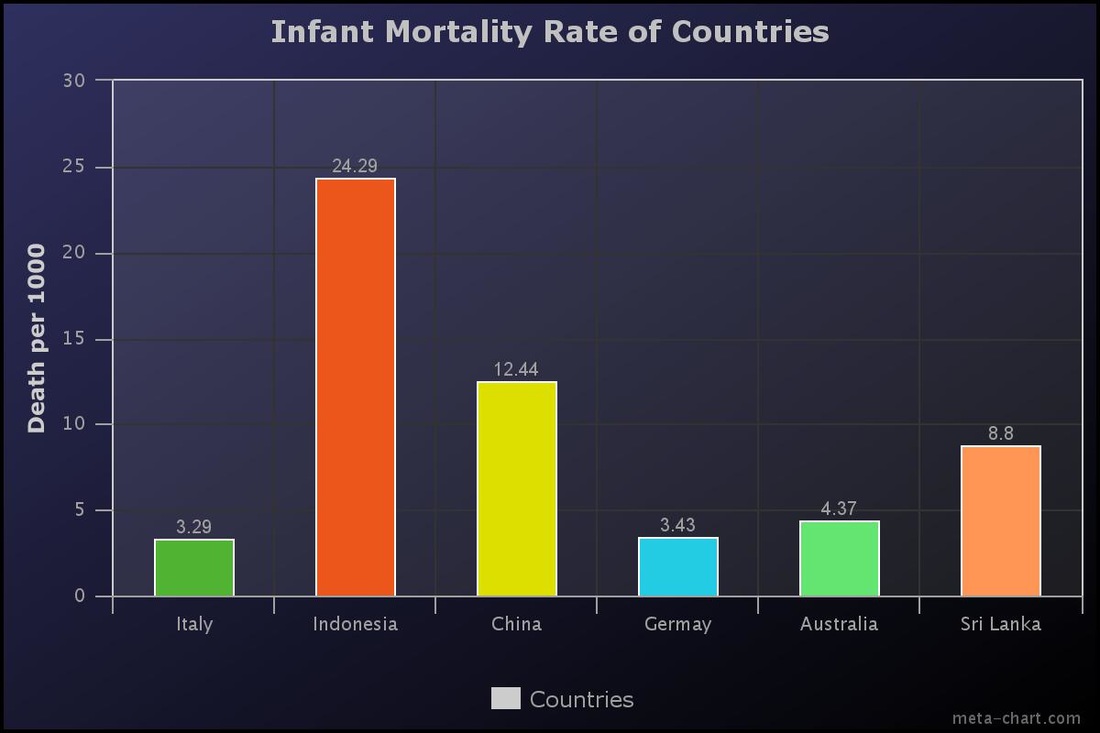
Bar graphs helped us to understand population statistics by numerous collected results on one diagram. It is a good idea to use graphical representations to show numbers and display your collected information better because it gives people visual of what is being portrayed in information. Other ways that theses statistics could have been represented are by line graphs, pie charts, or a scatter plot graph.

|

|
|
|

Central Intelligence Agency. Central Intelligence Agency, n.d. Web. 14 Oct. 2015.
